
")
")
Large PHP developments, like Joomla!, Magento or PrestaShop can be very complex to debug without using a tool that provides variable inspections and breakpoints. This article describes how to configure your Ubuntu development machine with debug capabilities.
1Install Xdebug
Xdebug is a PHP extension for powerful debugging, using BDGp protocol, that can be linked to Aptana, so it catches all breakpoints from your local web server, in this case, Apache.
1.1. Install package
In Ubuntu 12.04, as simple as:
sudo apt-get install php5-xdebug
1.2. Configure
In case you need it in order to change port, i.e., configuration file is /etc/php5/apache2/conf.d/xdebug.ini. This are the standard contents:
zend_extension=/usr/lib/php5/20090626/xdebug.so

xdebug.profiler_output_dir=/var/log/xdebug
xdebug.profiler_enable_trigger=1
xdebug.profiler_enable=0

xdebug.remote_enable=true
xdebug.remote_host=127.0.0.1
xdebug.remote_port=9000
xdebug.remote_handler=dbgp
xdebug.remote_autostart=0
1.3. Restart Apache
Graceful, please:
sudo apache2ctl graceful
2Aptana configuration
We'll asume Xdebug is working, and go straight to configure Aptana:
2.1. General preferences
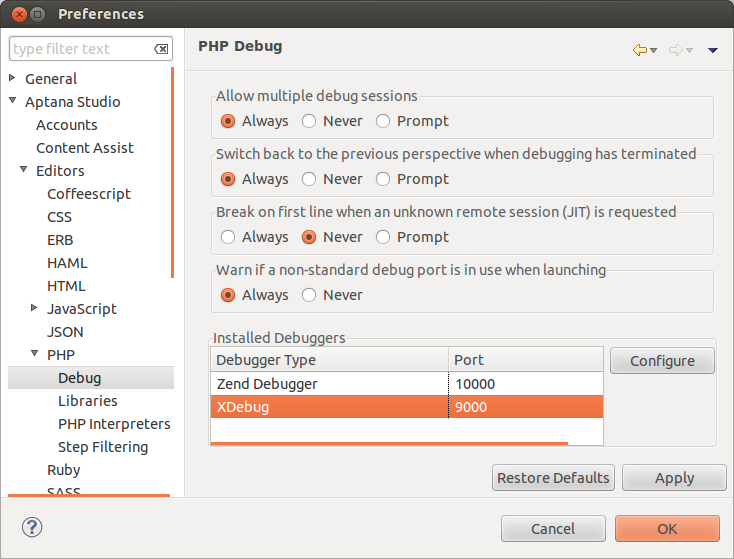
First, check that Xdebug is properly configured in Window → Preferences → Aptana Studio → Editors → PHP → Debug. It should be in the installed debuggers, and with the same port that is in xdebug.ini.
Now you should make Aptana to use an external browser, in Window → Preferences → General → Web Browser.
2.2. Debug configurations
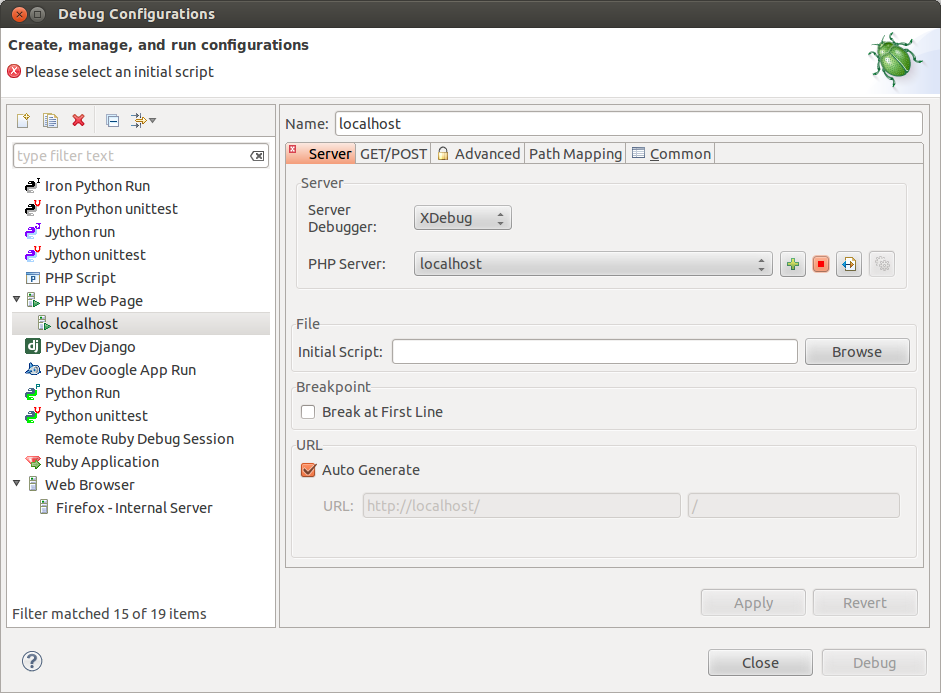
Next step is tell Aptana how will debug. Go to Run → Debug Configurations, select PHP Web Page, and press the 'New' button. Select XDebug as server debugger and create a new PHP server, with following data:
- Name: localhost
- Base URL: http://localhost
- Document Root: /var/www
3Browser configuration
Last step is add an extension for your favourite browser, in order to enable or disable debug easily.
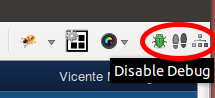
3.1. Mozilla Firefox
The easiest Xdebug: https://addons.mozilla.org/es/firefox/addon/the-easiest-xdebug/
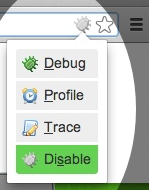
3.2. Google Chrome
Xdebug helper: https://chrome.google.com/webstore/detail/eadndfjplgieldjbigjakmdgkmoaaaoc
4Debug!
That's it! You can now switch to debug perspective in aptana, add breakpoints in your code, inspect variable values, etc. Just enable debug in your browser, navigate to a page that uses your PHP script and wait for your breakpoint to jump.
Sources / More info
http://yllus.com/2013/01/20/using-xdebug-with-aptana-studio-3-nginx-and-php-fpm/
UPDATE
In case you found problems, like segmentation faults, try disabling coredump generation from Apache, with this commands:
ulimit -c 0
sudo /etc/apache2/restart
If you still have problems, try removing Xdebug from repositories and installing from PECL:
sudo apt-get remove php5-xdebug
sudo apt-get install php5-dev
sudo pecl install xdebug